Logo (Main page)

The LMC impact on the kinematics of the Milky Way satellites: clues from the running solar apex

Russian version

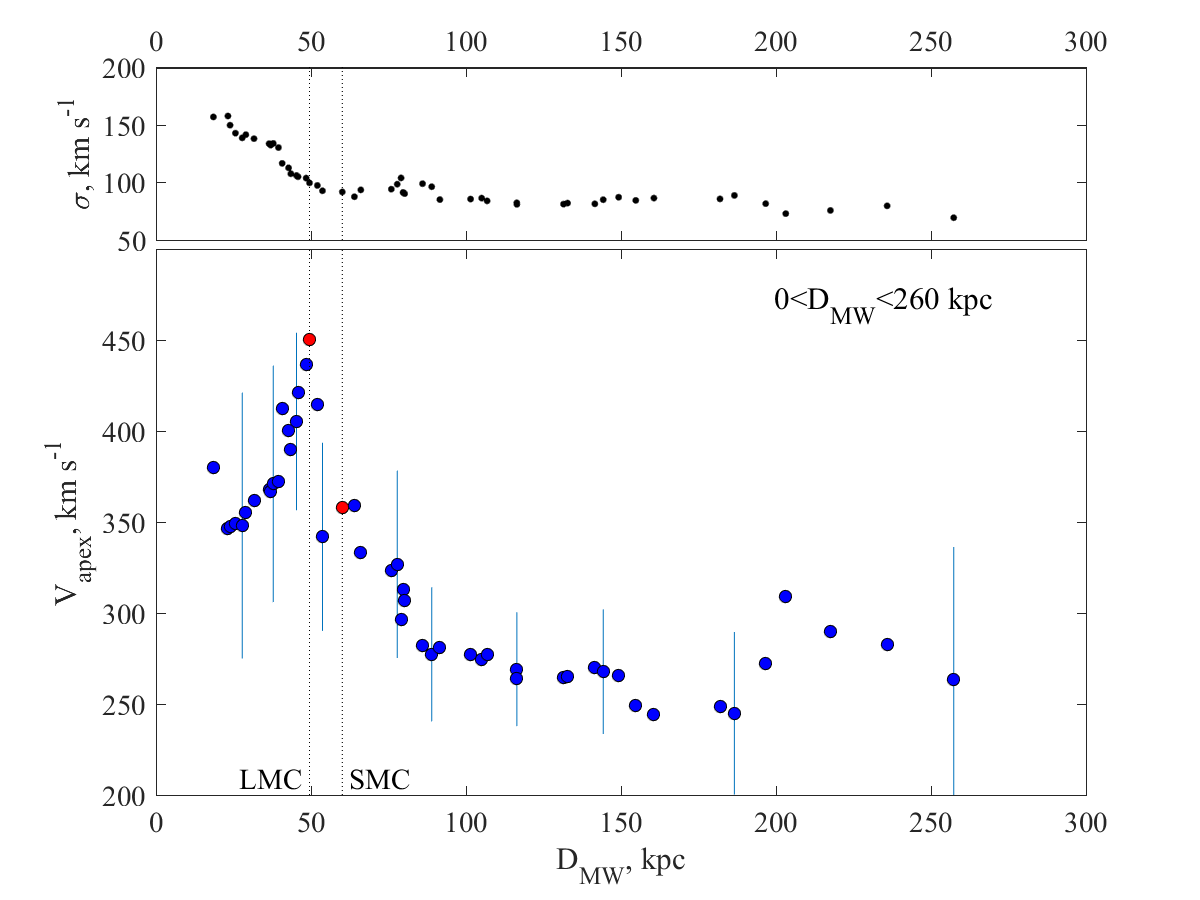
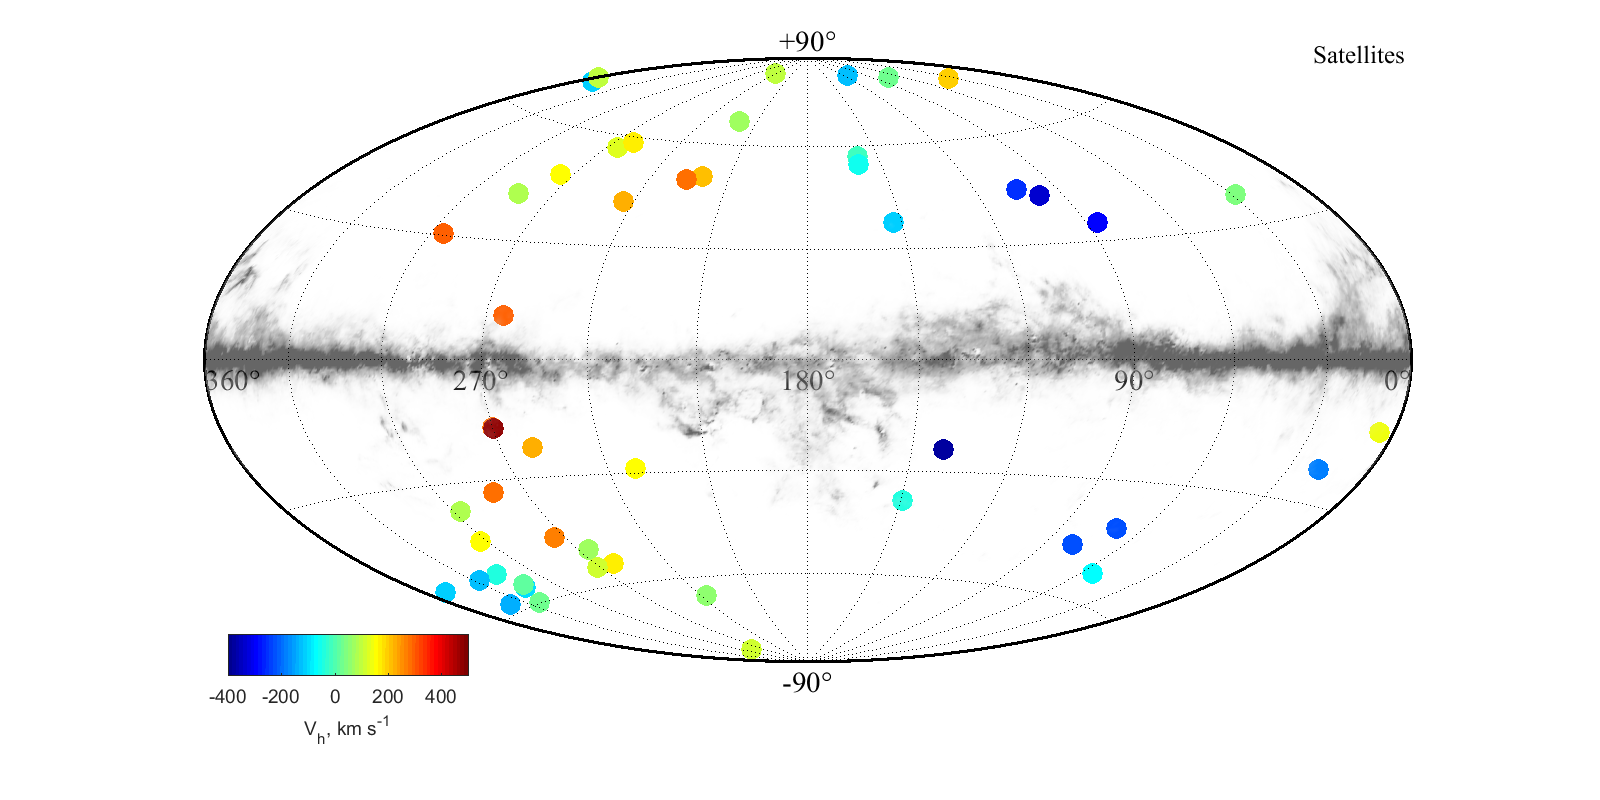
    Dwarf galaxies provide a unique opportunity for studying the evolution of the Milky Way and the Local Group as a whole. Analysing the running solar apex based on the kinematics of the Milky Way satellites, we discovered an unexpected behaviour of the dipole term of the radial velocity distribution as a function of the galactocentric distance. The nearby satellites (<100 kpc) have a bulk motion relative to our Galaxy with an amplitude of 140-230 km/s. The more distant ones show an isotropic distribution of the radial velocities. Such strong solar apex variations can not be explained by the net rotation of the subsystem of satellites, as it would require an enormously high rotation rate of about 1000 km/s, which is obviously unphysical. From our point of view, the most likely for the observed effect is the distortion of the velocity field caused by the first passage of the Large Magellanic Cloud with it's suite around the Milky Way and the perturbation caused by the movement of such a massive galaxy through a swarm of satellites of our Galaxy. Numerical simulation shows that the observed pattern of satellite velocities is reproduced when an object with a mass of 2 × 1011 M⊙ moves through a group of satellites of the Milky Way.

Fig. 1. The ‘evolution’ of the apex velocity with the Galactocentric distance.
The amplitude of the solar apex for each point is estimated from the line-of-sight velocities of 21 satellites.
The apexes centred on the Large and Small Magellanic Clouds are marked in red.
Error bars are shown only for every fifth measurement, so as not to clutter the figure.
The standard deviation of the residual velocities are shown in the top panel.
Fig. 2. Distribution of satellites of our Galaxy over the sky in Galactic coordinates.
The satellites are colored according to their observed velocities relative to the Sun.
The zone of high extinction in the Milky Way is shown in a gray-scale belt.
The direction towards the Galactic anticenter is in the centre of the map.
Fig. 3. Maps of radial velocity distribution of halo particles, obtained in the N-body simulations of the Milky Way and the Large Magellanic Cloud interaction.
Each panel shows a map of line-of-sight velocities averaged over a given range of distances from the center of our Galaxy.
The position of the Large Magellanic Cloud of 2 × 1011 solar masses is shown by the red dot in the upper left panel.

The work was carried out within the framework of the grant from the Ministry of Science and Higher Education of the Russian Federation № 075-15-2022-262 (13.MNPMU.21.0003).

Published:
Makarov Dmitry, Khoperskov Sergey, Makarov Danila, Makarova Lidia, Libeskind Noam, Salomon Jean-Baptiste, “The LMC impact on the kinematics of the Milky Way satellites: clues from the running solar apex”, Monthly Notices of the Royal Astronomical Society, Volume 521, Issue 3, May 2023, Pages 3540-3552

Contact person — D.I. Makarov, DSc, Prof. of the RAS, Head of the Laboratory of Extragalactic Astrophysics and Cosmology, SAO RAS..